

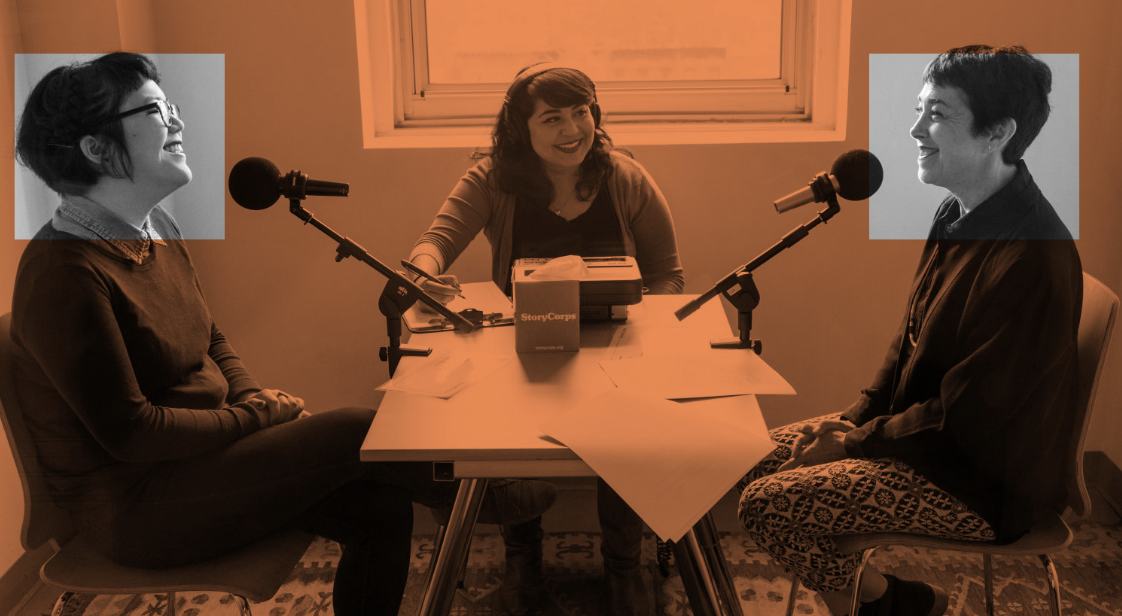
StoryCorps’ One Small Step Project
It's no secret that politics in the U.S. has become increasingly polarized in recent years. We see it in our social media feeds; we read it in the news; we hear it in conversations with our colleagues and neighbors. For many of us, it's as if party lines have turned into walls we can't see over or around. In December 2019,

Telling Visual Stories with Data
Compelling, code-based data visualizations like those in The New York Times and FiveThirtyEight turn complex data into digestible information for the public. In January 2020, Montana Free Press data reporter Eric Dietrich hosted a two-day workshop at the Montana Media Lab to guide participants through his workflow for creating data visualizations. Participants learned to clean, visualize and annotate data to produce